
Predictability Of A Volatility-Leveraged ETF
The rise in internet-based retail stock trading has spawned a great deal of online discussion about various securities and trading strategies. My contribution here consists of some observations I have had about one particular exchange-traded fund (ETF).
ProShares Ultra VIX Short-Term Futures ETF (UVXY) is a volatility-based fund that is balanced to gain value quickly in times of short-term volatility in the S&P 500.
Two casual observations inspired this data analysis:
- Within a single day, UVXY tends to perform inversely to the overall stock market.
- Over the long term, UVXY’s value closely follows an exponential decay.
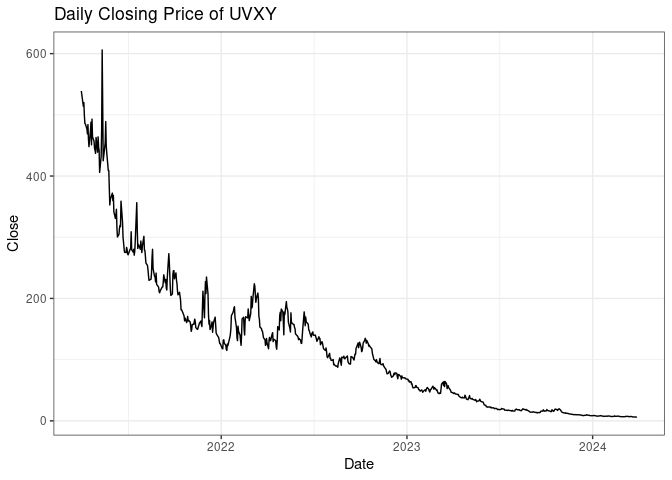
The decay appears clearly when the values over the last three years are plotted, but the plot also shows occasional large spikes upward. I set out to compare UVXY to several other funds with the goal of identifying signals that could forecast whether UVXY will increase or decrease in value each day. I focus on simple indicators based on the relative performance of these funds on the same day and the previous day, and on these two outcomes:
- UVXY closing value relative to the previous day’s closing value
- UVXY closing value relative to the opening value
Study Design
I downloaded daily candle data (Open, High, Low, Close) for all trading days from April 1, 2021, through March 31, 2024, from Yahoo! Finance. I included UVXY and:
- ProShares Bitcoin Strategy ETF (BITO), invests in Bitcoin futures and meant to resemble the performance of Bitcoin (launched October 2021)
- ProShares Ultra QQQ ETF (QLD), an equity-based fund
- ProShares UltraPro Short QQQ ETF (SQQQ), an inverse-equity fund
- ProShares UltraPro QQQ ETF (TQQQ), an equity-based fund
- ProShares UltraPro DOW30 ETF (UDOW), invests in blue-chip US companies
- ProShares UltraPro S&P500 ETF (UPRO), invests in large-cap US companies
- Fidelity 500 Index Fund (FXAIX), meant to track the S&P 500
There are two footnotes regarding the data:
- Candles for BITO are available only back to October 20, 2021.
- FXAIX is not an ETF, so only a single daily value is available rather than a full candle. I labeled this as the Close value.
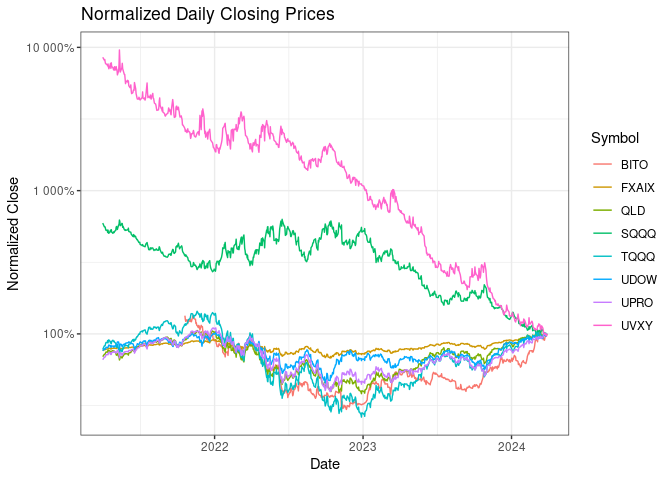
The following figure shows the trends in closing values since April 2021. The values are normalized so that the end of March 2024 is 100%.
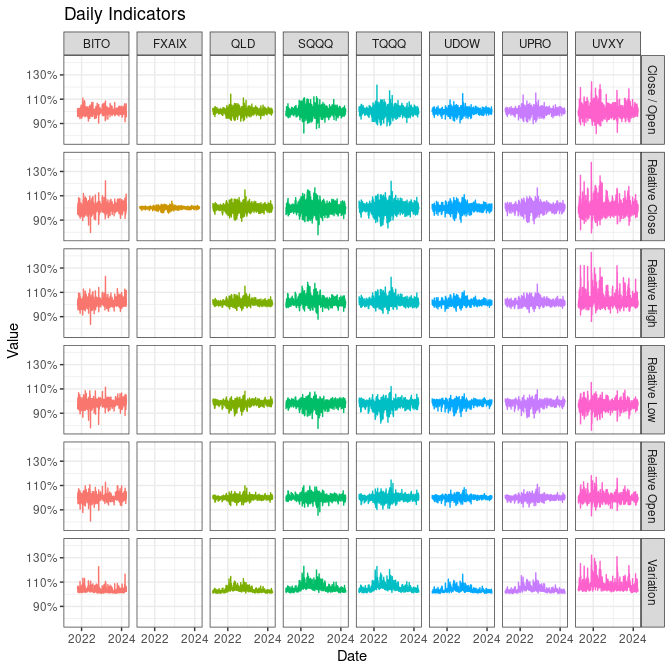
The focus of the analysis is on single-day trends, so I used relative values. I defined relative values as each candle value divided by the previous closing value. I also captured within-day variation as High / Low and within day trend as Close / Open.
Analysis
UVXY is more likely than not to lose value on a scale of a day or larger, with a median Close / Open ratio of 99.1%, a median Close / Previous Close ratio of 98.7%, and a median Open / Previous Close ratio of 99.5%. However, UVXY has the largest variation of the funds included in this analysis, with a median High / Low ratio of 106.4%. It also exceeded the previous closing value on a majority of days, with a median High / Previous Close ratio of 102.4%.
| Symbol | Indicator | Avg | SD | Min | Q1 | Median | Q3 | Max |
|---|---|---|---|---|---|---|---|---|
| BITO | Close / Open | 99.9 | 2.4 | 90.4 | 98.8 | 99.9 | 101.0 | 110.9 |
| BITO | Relative Close | 100.0 | 3.8 | 79.8 | 98.1 | 99.9 | 102.1 | 122.3 |
| BITO | Relative High | 101.7 | 3.4 | 83.7 | 99.8 | 101.2 | 103.1 | 123.1 |
| BITO | Relative Low | 98.4 | 3.3 | 78.0 | 96.7 | 98.6 | 100.0 | 111.4 |
| BITO | Relative Open | 100.1 | 2.9 | 80.8 | 98.7 | 100.0 | 101.4 | 112.7 |
| BITO | Variation | 103.4 | 2.2 | 100.7 | 101.9 | 102.8 | 104.1 | 122.7 |
| FXAIX | Relative Close | 100.0 | 1.1 | 95.7 | 99.4 | 100.0 | 100.7 | 105.6 |
| QLD | Close / Open | 100.1 | 2.5 | 91.9 | 98.7 | 100.2 | 101.6 | 114.1 |
| QLD | Relative Close | 100.1 | 2.9 | 89.0 | 98.5 | 100.2 | 101.8 | 114.8 |
| QLD | Relative High | 101.7 | 2.1 | 95.0 | 100.4 | 101.4 | 102.7 | 115.0 |
| QLD | Relative Low | 98.3 | 2.2 | 87.8 | 97.1 | 98.6 | 99.7 | 108.1 |
| QLD | Relative Open | 100.0 | 1.6 | 93.5 | 99.1 | 100.0 | 100.8 | 109.8 |
| QLD | Variation | 103.4 | 1.9 | 100.8 | 102.1 | 103.0 | 104.3 | 114.6 |
| SQQQ | Close / Open | 99.8 | 3.6 | 82.2 | 97.7 | 99.7 | 101.9 | 112.0 |
| SQQQ | Relative Close | 99.9 | 4.3 | 78.0 | 97.3 | 99.8 | 102.4 | 116.5 |
| SQQQ | Relative High | 102.6 | 3.4 | 88.0 | 100.5 | 102.2 | 104.3 | 118.2 |
| SQQQ | Relative Low | 97.5 | 3.2 | 77.5 | 95.9 | 97.9 | 99.4 | 107.5 |
| SQQQ | Relative Open | 100.0 | 2.4 | 85.5 | 98.8 | 99.9 | 101.3 | 109.8 |
| SQQQ | Variation | 105.2 | 2.9 | 101.1 | 103.3 | 104.5 | 106.5 | 123.0 |
| TQQQ | Close / Open | 100.1 | 3.7 | 88.0 | 98.0 | 100.3 | 102.3 | 121.6 |
| TQQQ | Relative Close | 100.1 | 4.3 | 83.5 | 97.7 | 100.2 | 102.8 | 121.9 |
| TQQQ | Relative High | 102.5 | 3.2 | 92.5 | 100.6 | 102.1 | 104.1 | 122.4 |
| TQQQ | Relative Low | 97.4 | 3.4 | 81.9 | 95.6 | 97.9 | 99.6 | 111.9 |
| TQQQ | Relative Open | 100.0 | 2.4 | 90.3 | 98.7 | 100.1 | 101.2 | 114.5 |
| TQQQ | Variation | 105.2 | 2.9 | 101.2 | 103.2 | 104.5 | 106.5 | 122.8 |
| UDOW | Close / Open | 100.1 | 2.3 | 90.6 | 98.7 | 100.2 | 101.3 | 114.6 |
| UDOW | Relative Close | 100.1 | 2.8 | 88.2 | 98.6 | 100.1 | 101.7 | 110.9 |
| UDOW | Relative High | 101.6 | 2.1 | 94.5 | 100.4 | 101.4 | 102.7 | 111.1 |
| UDOW | Relative Low | 98.3 | 2.3 | 87.4 | 97.2 | 98.6 | 99.7 | 105.9 |
| UDOW | Relative Open | 100.0 | 1.6 | 92.2 | 99.2 | 100.0 | 100.9 | 108.2 |
| UDOW | Variation | 103.4 | 1.9 | 100.7 | 102.0 | 102.9 | 104.3 | 116.4 |
| UPRO | Close / Open | 100.1 | 2.7 | 89.9 | 98.7 | 100.2 | 101.6 | 115.0 |
| UPRO | Relative Close | 100.1 | 3.3 | 87.0 | 98.3 | 100.1 | 102.0 | 116.4 |
| UPRO | Relative High | 101.8 | 2.4 | 93.5 | 100.4 | 101.4 | 103.0 | 116.8 |
| UPRO | Relative Low | 98.1 | 2.6 | 86.1 | 96.9 | 98.6 | 99.8 | 109.2 |
| UPRO | Relative Open | 100.0 | 1.9 | 92.3 | 99.1 | 100.1 | 101.0 | 111.0 |
| UPRO | Variation | 103.8 | 2.3 | 100.5 | 102.2 | 103.2 | 104.7 | 117.6 |
| UVXY | Close / Open | 99.7 | 5.0 | 81.7 | 96.7 | 99.1 | 102.0 | 124.2 |
| UVXY | Relative Close | 99.6 | 6.0 | 79.5 | 96.1 | 98.7 | 102.5 | 137.4 |
| UVXY | Relative High | 103.7 | 5.9 | 86.1 | 100.3 | 102.4 | 105.6 | 142.8 |
| UVXY | Relative Low | 96.5 | 3.9 | 76.0 | 94.5 | 96.6 | 98.5 | 115.3 |
| UVXY | Relative Open | 99.9 | 3.4 | 85.0 | 98.0 | 99.5 | 101.4 | 118.1 |
| UVXY | Variation | 107.5 | 4.4 | 101.4 | 104.5 | 106.4 | 109.3 | 132.1 |
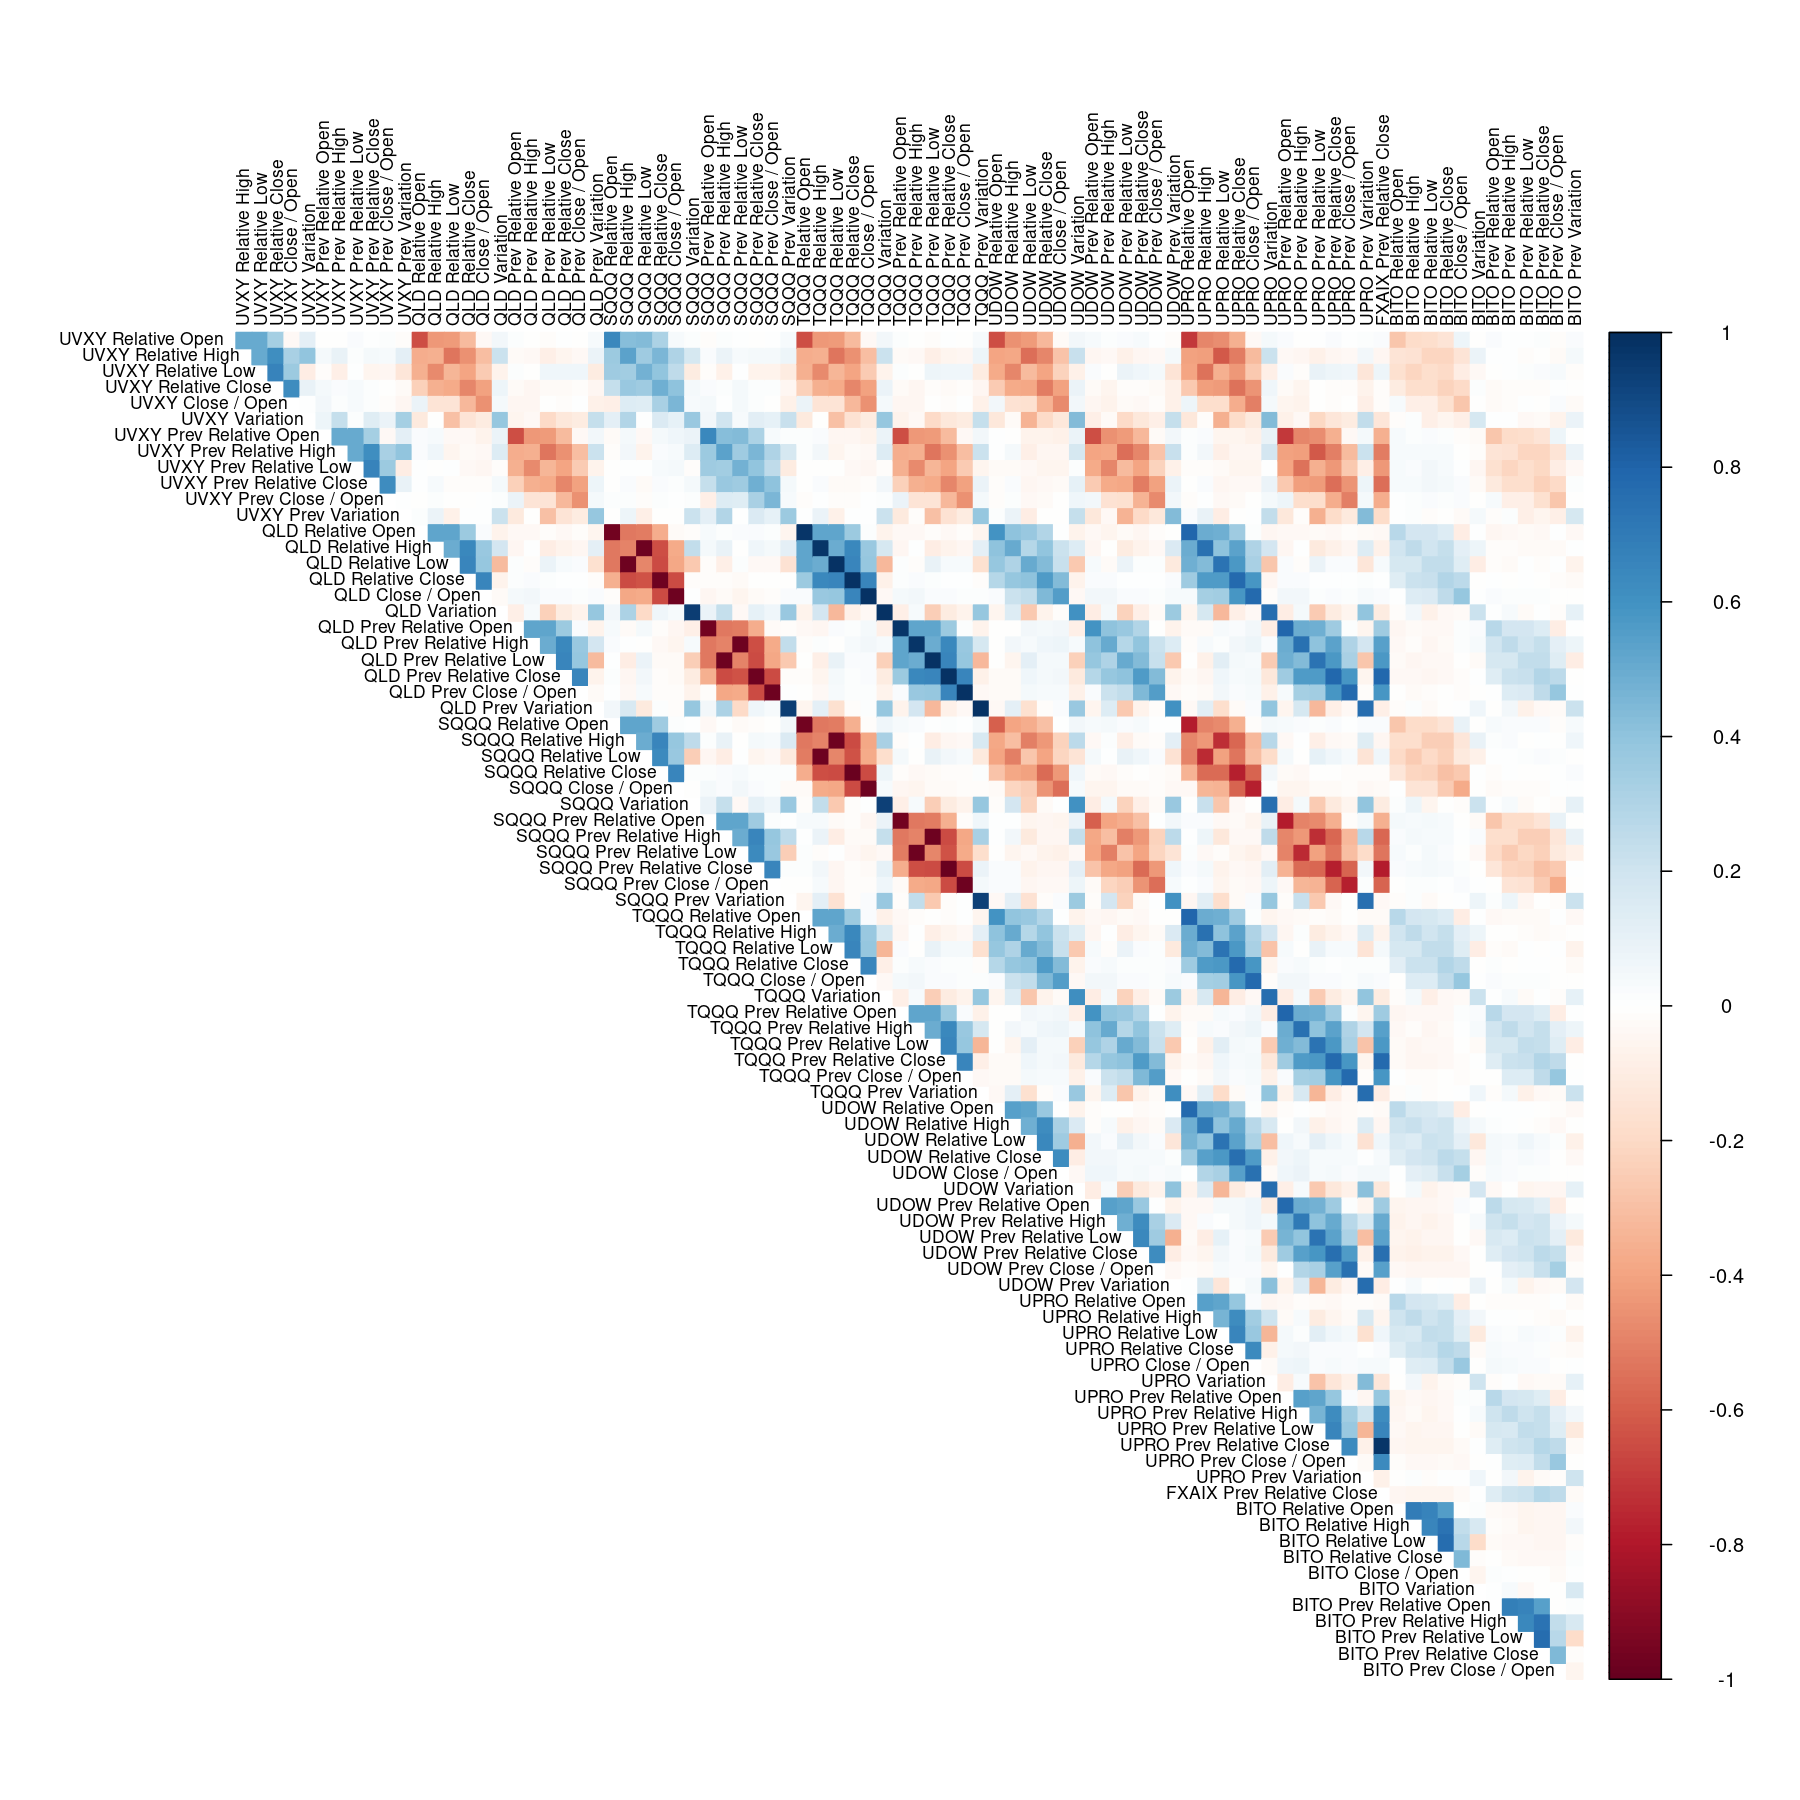
To compare across the different funds, I computed the Kendall correlations among the various indicators. The UVXY indicators are moderately positively correlated with the same-day SQQQ indicators (this is the other fund designed to gain value in times of short-term volatility), weakly negatively correlated with the same-day BITO indicators, and moderately negatively correlated with the other same-day indicators.
The outcomes of primary interest (UVXY Relative Close and Close / Open) appear largely uncorrelated with all of the previous-day indicators. In contrast, UVXY Relative High and Relative Low do have weak correlations with the previous-day indicators. Relative High is very weakly positively correlated with some of the UVXY and SQQQ previous-day indicators, and very weakly negatively correlated with most other previous-day indicators except those for BITO. Relative low has the same relationships but in the opposite direction.
Discussion
Regarding the primary goal of identifying signals that could predict if UVXY will close higher than it opened, or higher than it closed on the previous trading day, this analysis is inconclusive. I showed that UVXY has unsurprising correlations with the values of other funds on the same day, but without an association with any previous-day indicators, or a stronger association with Relative Open, there is not much actionability in these findings.
This analysis does raise some questions worthy of follow-up analysis. The high within-day variation of UVXY, and the large chance that, at some point throughout each day, it will exceed the previous closing value even though it tends to trend down (recall the median Relative High of 102.4%) make this ETF appealing for day trading. A further analysis at a resolution finer than daily could help develop strategies for frequent trading. This could help illuminate the correlations of Relative High and Relative Low with the previous-day indicators, to address whether that was a spurious finding, or if the magnitude or timing of the high/low could be predictable.